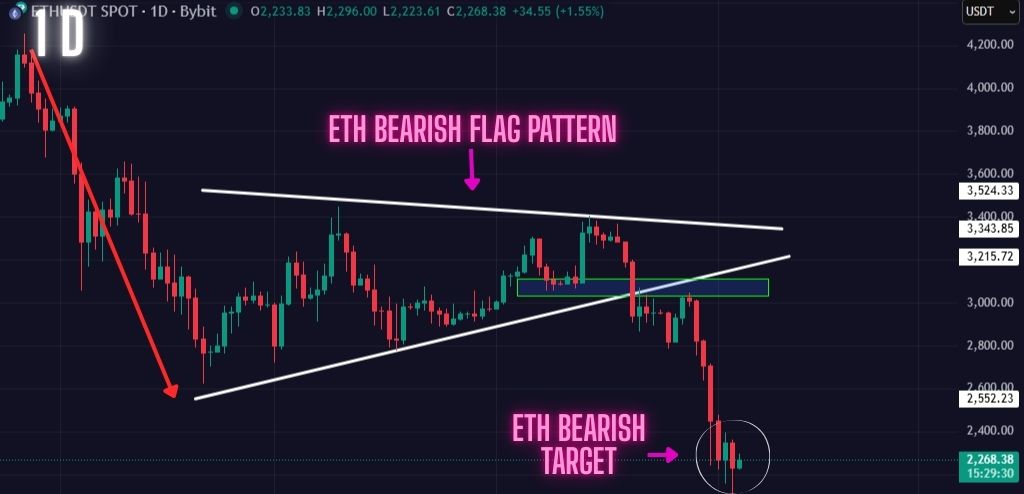
ETH Bearish Flag Pattern Completed
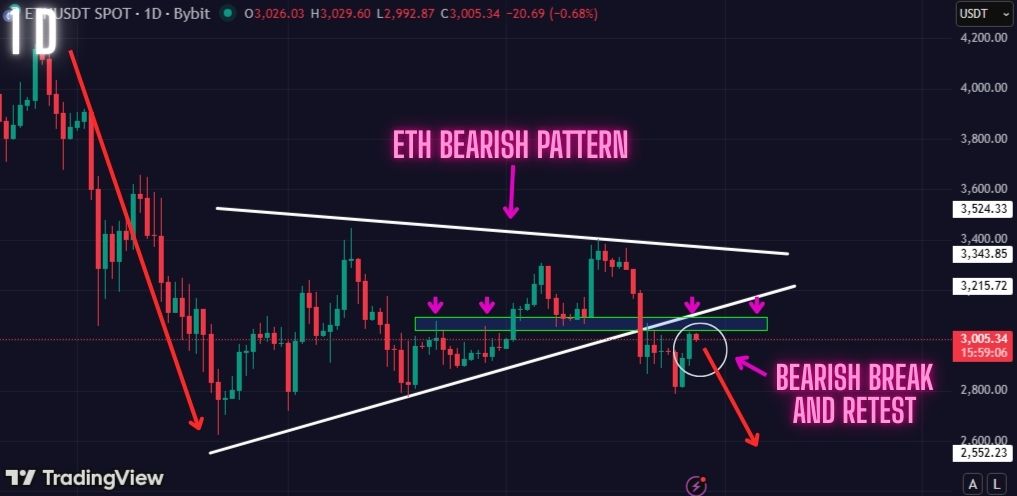
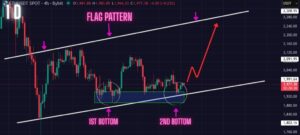
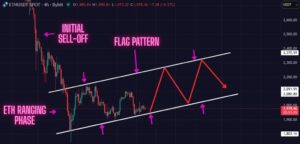
In our previous analysis, we identified the bearish Flag Pattern that was in play on the Daily timeframe and warned our readers of the potential sell-off that was setting up to happen.
Well, since publish that TA, we have seen the ETH price crash down to the $2,100 price level, completing the bearish flag pattern.
In this ETH analysis, we will be updating you on the current price action for Ethereum, the key support zone we are watching, as well as what we think might be setting up next.
Start trading BTC,ETH, and a variety of popular cryptocurrencies with leverage as high as 100x on Bybit right now! Sign-up with our Bybit link to claim exclusive rewards of up to 6,045 USDT bonus
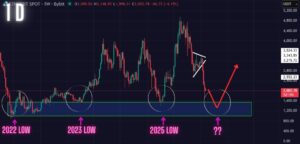
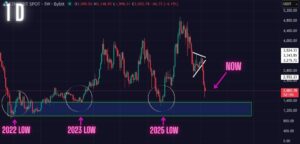
Ethereum Testing This key Support. Will It Hold?
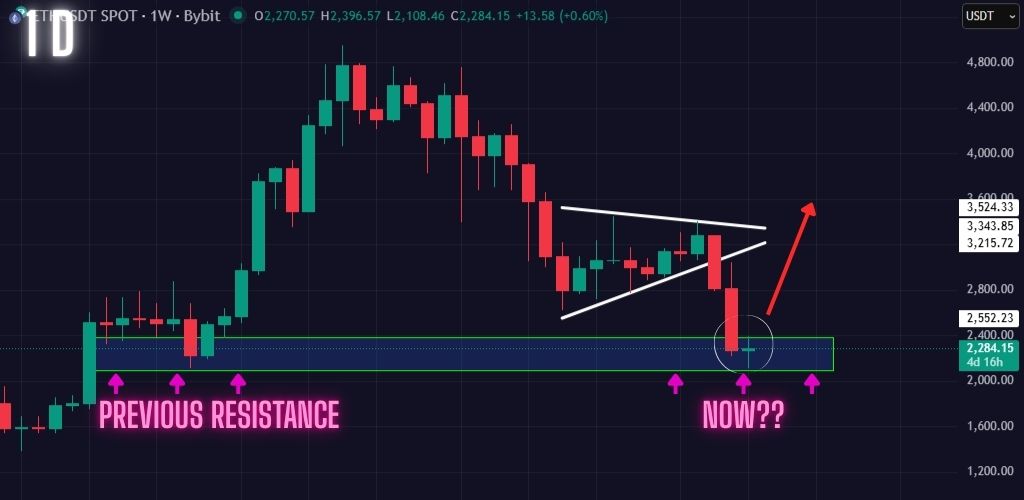
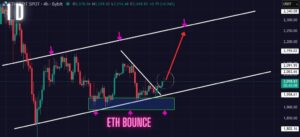
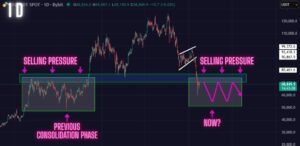
The Ethereum price is right now testing a major support zone on the Daily timeframe. This key level has severed as a major Ethereum buying zone in the past and might do so again in the coming weeks.
If the ETH bulls want to stop any furtherer sell-off from happening, we need to see this $2,000 support zone hold at all cost. A failure to defend this $2,000 support could easily see the Ethereum price crashing more aggressively in the coming days.
So for now, we continue watching the price to see how it would develop in the coming days.
Final Verdict!
The Ethereum bears are still in full control of this market. However, the bulls now have a chance to wrestle back control of the market. And that all depends on how the ETH price reacts to this $2,000 key support zone on the Daily timeframe.
If the ETH bulls want to stop any further sell-off from happening, we need to see this $2,000 support zone hold at all cost.
New to the idea of leverage trading? Check out this article list: