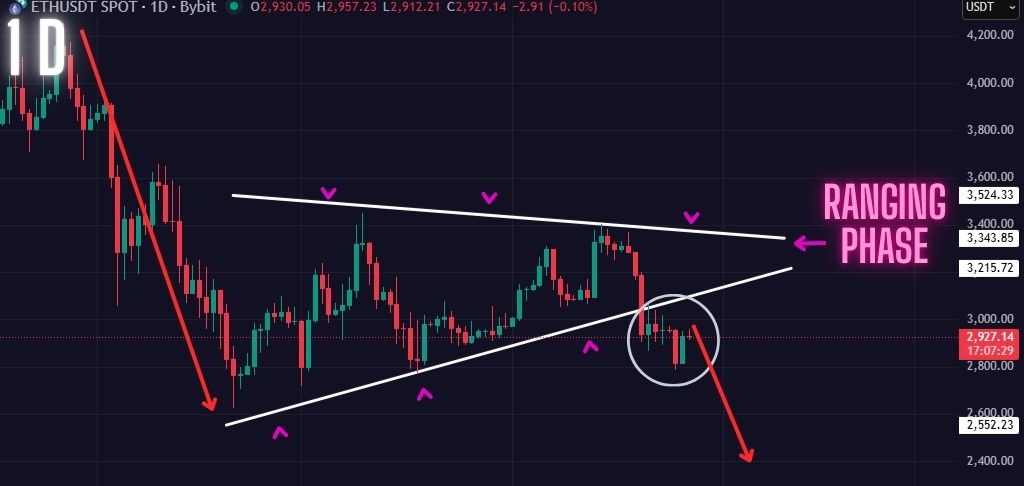
Ethereum Bears Are in Full Control. Watch This Key Pattern!
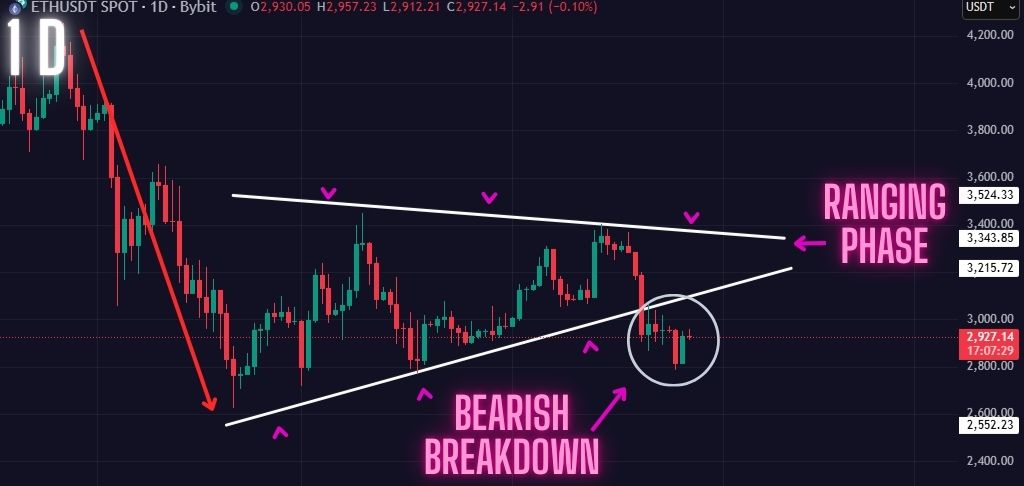
The Ethereum price has been ranging sideways for weeks now. And finally, we are seeing a price breakdown on the Daily timeframe.
In this ETH analysis, we will be talking about what this bearish price breakdown means for the Ethereum bulls, as well as the key pattern we are currently tracking right now on the Daily timeframe.
Start trading BTC,ETH, and a variety of popular cryptocurrencies with leverage as high as 100x on Bybit right now! Sign-up with our Bybit link to claim exclusive rewards of up to 6,045 USDT bonus
Ethereum Bearish Converging Pattern
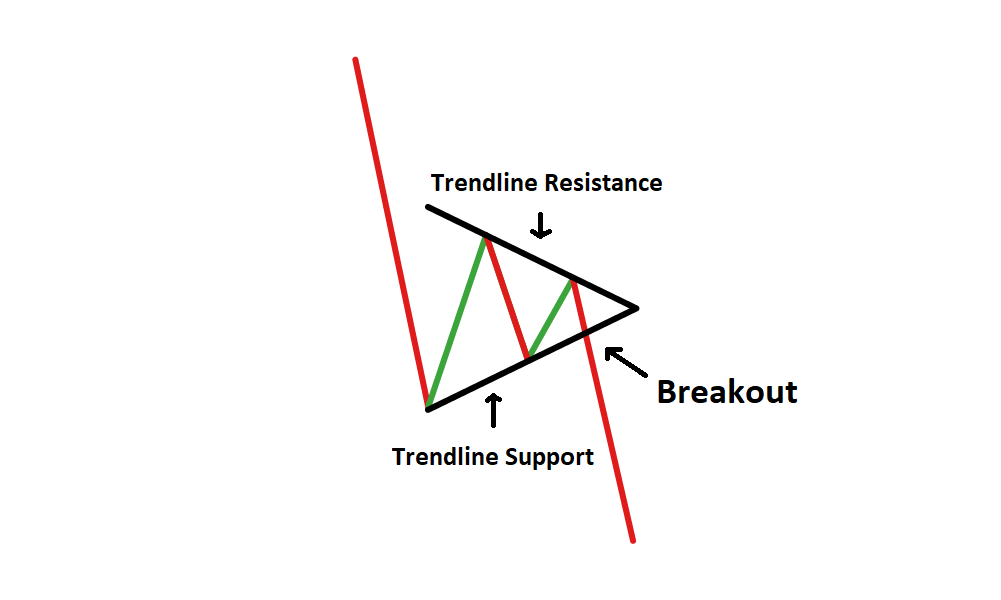
The key pattern we are currently tracking is a Bearish Converging Pattern currently playing out on the Daily timeframe. This pattern is very important because it indicates that the bears are still in full control of this price action, and we can expect to see more sellers step into the market in the coming days.
For Ethereum, the presence of this key bearish Converging pattern indicates that the ETH price might be setting up to make a massive move lower towards the $2,500 price region in the coming days.
So for now, we are very bearish on Ethereum and will remain bearish as far as this key converging pattern continues to get respected on the Daily timeframe.
Final Verdict!
The Ethereum bears are in full control of the ETH price action right now.
New to the idea of leverage trading? Check out this article list:

